While the NFL has established itself as one of the most dominant sports program in the nation, in terms of viewers and revenue, there has been a huge decline in participation from younger athletes due to the concerns of a disease that has come to the forefront in recent years. Chronic Traumatic Encephalopathy, or more commonly known and referred to as CTE, has changed the way not only the game is played but how it is seen by both fans and outsiders of the game.
CTE is defined as a degenerative brain disease found in a people who have a history of repetitive brain trauma (Boston University). This can lead to memory loss as well as changes in mood and behavior which only get worse over time. The alarming part of this disease is that it can go unnoticed in athletes until the symptoms begin appearing or by cutting open their brains. In response to multiple player deaths being traced back to CTE, the NFL has implemented new protocols and standards to combat with players who get concussions during games.
While most are unaware of the impact and existence of the CTE disease, people are aware of the issue of concussions, because of their graphic existence in the game. What makes concussions an interesting case for scientific graphics and communication is that designers are able to portray an internal injury as well as the extent of the damage and consequences. The highlight and clip of the hit is not needed to visual how the story unfolds when visuals are used correctly to convey the story of the concussion.
According to Dr. Bill Dennison, visual literacy for science communication can have a number of different visuals including photos, maps, graphs, videos, as well as combining multiple visuals (Dennison). Below I gathered a number of visuals related to concussions in the NFL and explain how each is communicated in its own way with the same goals in mind.

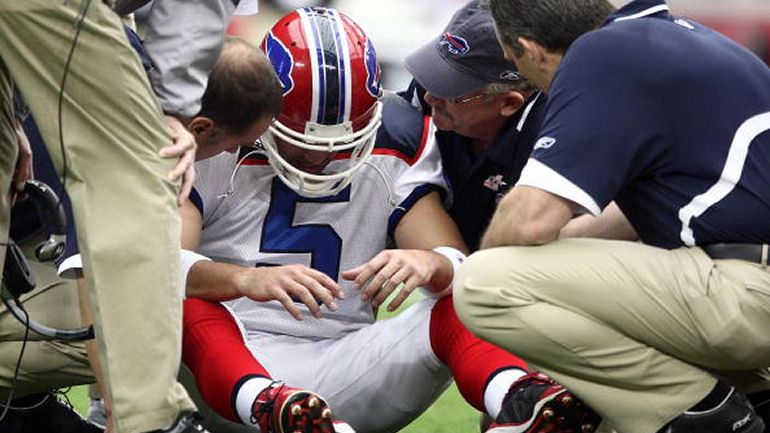
Visuals like a crashed car and police tape help to convey the dangers of drinking/texting and driving. Showing the outcome and consequences can sometimes help to hit home the dangers when the actions it takes are already known. Here we have a Broncos wide receiver who has just sustained a concussion and was used to cover a number of articles relating to concussions. What makes this journalistic photo so powerful? Its seeing the face of the injured player as he’s frozen in time with a medical staff member sitting over him and a player concerned for his teammate. It is the role of the storyteller to engage the audience with situations (Campbell). Pausing the game if you will puts the viewer in the same position and feeling as the player, which would otherwise be overlooked from a broadcast camera that then cuts to commercial.
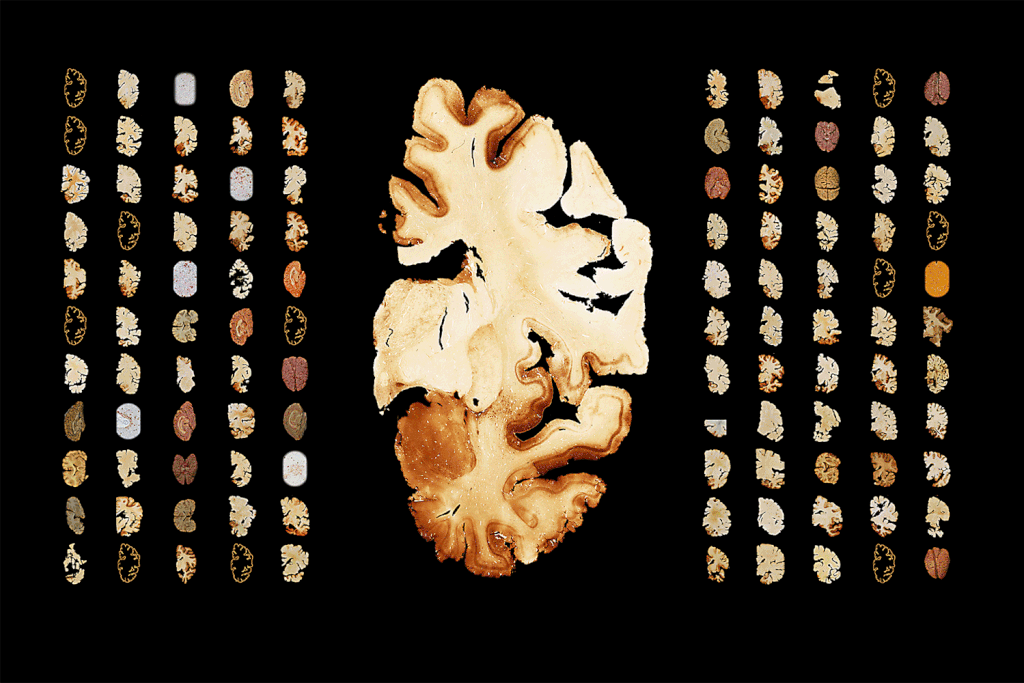
The next visual helps to put into perspective how many players of each position on the field were found to be deceased with CTE. While any player can get concussed at any time with the right amount of contact to the head, this infographic takes a different approach by taking away numbers and using only visuals to convey its message on how many players retire with CTE. Why take out the numbers? Even though there are 110 brain scans in this visual, it is easy to see there is an overwhelming number of linemen who were found with CTE which tells us that the main message is that linemen are most at risk.
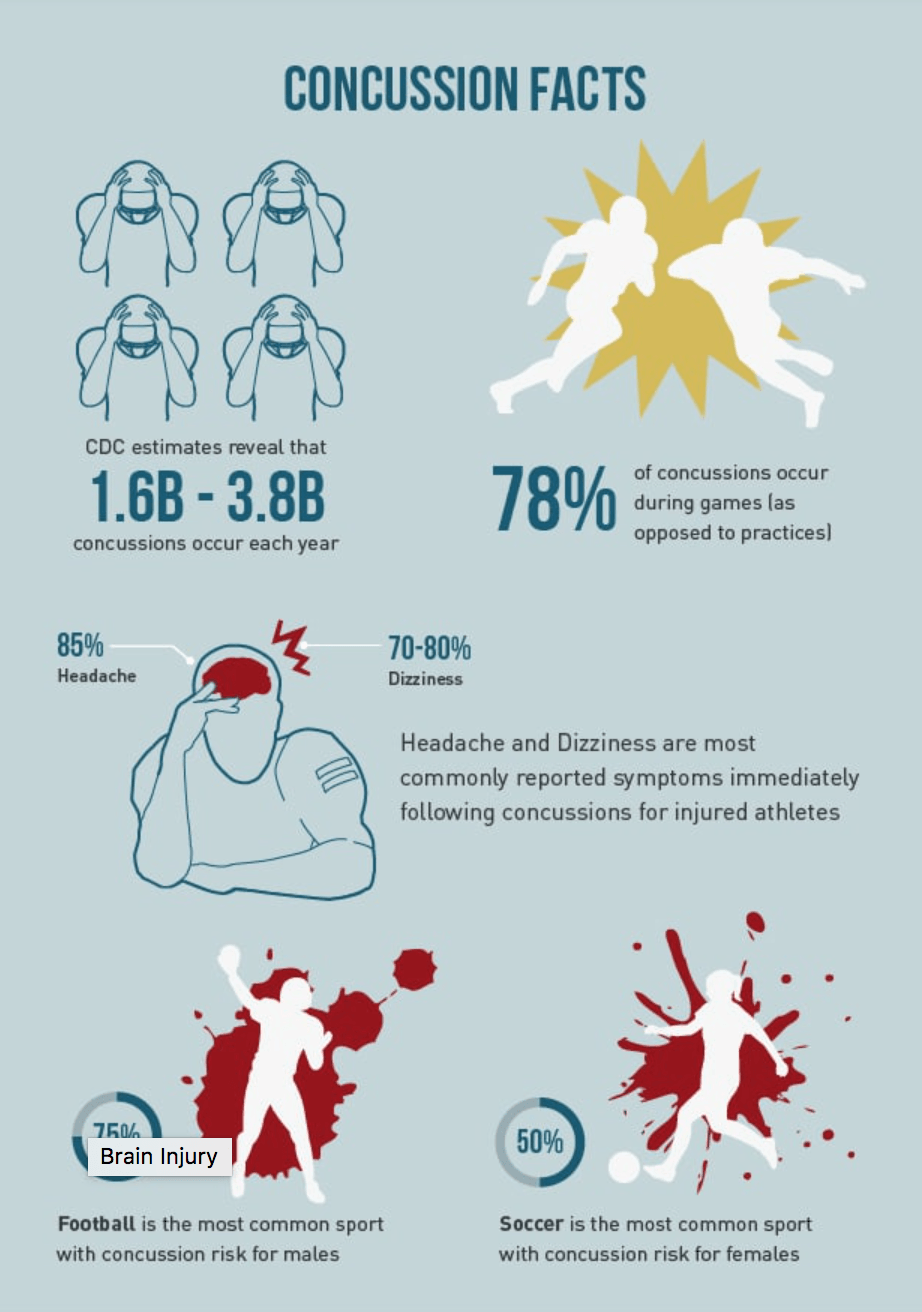
This infographic helps to put into perspective how many concussions are sustained in sports games each year as well as the side effects through their use of graphics and numbers. Using the graphics of players holding their heads in pain helps to show that many are affected by concussions by having the same color blue link the graphics of the four players to the 1.6B to 3.8B concussions numerical. Faithfully representing the data is as essential to the value of scientific visualization as telling a good science story (Kostis and Cohen). It is one thing to talk about and show the pain of concussions, but by showing how many people are affected supported by scientific numbers helps to bring almost a call to action as this will only continue if not dealt with directly. And having the yellow “crash” graphic and outline of players from gestalt theory helps viewers to play out the players hitting and crashing into each other in their heads even though the pictures are stand still. But what stands out the most on this infographic is the use of the color red to represent a throbbing head and blood splatters behind the outlines of the athletes. Color creates a sensory impression that reflects mood and emotion (Lupton). Concussions are internal injuries and are very graphic injuries if people knew their internal brain was bleeding but because it isn’t seen external the designer can use this knowledge and fact to their advantage to relay the message across.

This visual is helps to lay out how many players are concussed at each position by taking the numbers and adding them to where each position would line up on the field. This allows for easier reference at each position while also creating a video infographic sort of in itself. Much like x’s and o’s on a chalkboard, this visual can simulate a play for viewers in their head as they try and visualize how is most likely to get hard contact on each play and why certain positions are higher in numbers than others. This relates back to the idea of the Gestalt principle of proximity and similarity because the elements are being perceived as belonging to the same group through having the same color and size (Bushe). These elements are able to be categorized and seen as belonging as one “team” which is why people familiar with football can pick up on the layout being the same of where players line up on the field which can be visually more effective than just labeling them as such.
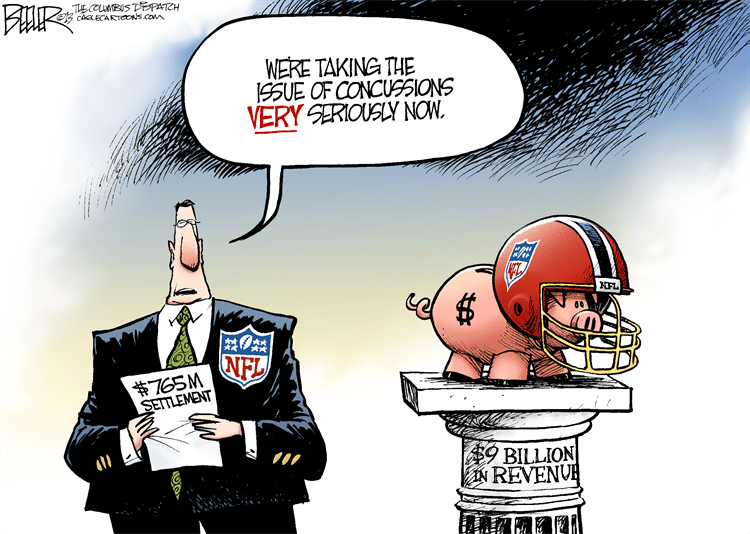
Above is a cartoon relating to the issues of concussions and CTE in players that I wanted to include to represent sort of the response of the NFL to these scientific discoveries and visualizations. While the NFL makes an impressive $9 billion in revenue, it only gives its former players $765 million in a settlement. The picture helps to show that the NFL is protecting its money assets and piggy bank with a helmet instead of worrying and helping its former and current players more. The NFL was criticized for downplaying the existence of the disease, which is why there is an emphasis on the word “very” with bold and red.
While the game is still being played today with new policies in place, the danger of concussions and CTE is still apparent for most. Athletes already in college and the NFL know the dangers but still choose to play for the love of the sport or need for money. But with less and less parents allowing their kids to play over the “violence” of the sport, the future of it could be called into question. Because visuals like the ones above, are now having lasting impacts with the support of scientific research behind them. Images are tools for scientists to help explain new theories and principles (Estrada and Davis). People can now not help to think about the damaged brain scans every time they see a big hit or refer to one they saw when seeing the graphics. Without visual communication effectively being used though, word about this disease may not have been spread widely as quick as it has.
Works Cited
“Act 2 Emotion.” Design Is Storytelling, by Ellen Lupton, Cooper Hewitt, Smithsonian Design Museum, 2017, pp. 56–111.
Beeler, Nate, et al. “NFL Concussions.” Cagle Post NFL Concussions Comments, www.cagle.com/nate-beeler/2013/09/nfl-concussions.
Boston University. “What Is CTE?” Concussion Legacy Foundation, 26 Nov. 2019, concussionfoundation.org/CTE-resources/what-is-CTE.
Busche, Laura. “Simplicity, Symmetry and More: Gestalt Theory and the Design Principles It Gave Birth To.” Learn, Canva, 15 May 2019, www.canva.com/learn/gestalt-theory/.
Campbell, David. “Why It’s Time for Visual Journalism to Include a Solutions Focus.” Medium, Witness, 17 Sept. 2019, witness.worldpressphoto.org/why-it-is-time-for-visual-journalism-to-include-a-solutions-focus-5be15aec3afc.
CBS. “NFL Players Battle Concussions To Get To The Super Bowl Championship.” CBS San Francisco, CBS San Francisco, 3 Feb. 2016, sanfrancisco.cbslocal.com/2016/02/03/nfl-players-battle-concussions-to-get-to-the-super-bowl-championship/.
Cunningham, Vinson. “A Haunting Video of Every Concussion Reported During the Current N.F.L. Season.” The New Yorker, The New Yorker, 2 Feb. 2018, www.newyorker.com/culture/annals-of-appearances/a-haunting-video-of-every-concussion-reported-during-the-current-nfl-season.
Davis, Lloyd. “Improving Visual Communication of Science Through the Incorporation of Graphic Design Theories and Practices Into Science Communication.” Research Gate, Jan. 2015, www.researchgate.net/publication/271516036_Improving_Visual_Communication_of_Science_Through_the_Incorporation_of_Graphic_Design_Theories_and_Practices_Into_Science_Communication.
Richards, Steve. “Concussions in the NFL (INFOGRAPHIC).” SportsNetworker.com Is the #1 Resource Online For Sports Business Professional Looking To Take Their Sports Career To The Next Level, www.sportsnetworker.com/2016/02/04/concussions-nfl-infographic/.
Snibbe, Kurt. “Concussions in the NFL Have Increased since Protocols Were Put in Place in 2012.” Orange County Register, Orange County Register, 9 Sept. 2018, www.ocregister.com/2018/09/08/concussions-in-the-nfl-have-increased-since-protocols-were-put-in-place-in-2012/.
Ward, Joe, et al. “111 N.F.L. Brains. All But One Had C.T.E.” The New York Times, The New York Times, 25 July 2017, www.nytimes.com/interactive/2017/07/25/sports/football/nfl-cte.html.